| Home |
|
|
|
|
Asymmetry; variation within populations
Lateral differences for
instance
of limb measurements have been found (B. Meier, pers. comm.;
Seth 1969).
In forms in which only few animals are available for
examination, it might
therefore be good to increase sample size by measuring both left
and right
limbs and other bilaterally
occurring
parts of the body in each animal (according to Swindler, 1976,
in teeth
there is no noticeable difference between right and left side;
Schwartz
and Beutel, 1995, however, recorded bilaterally different tooth
measurements).
In addition, comparison of
individual
size and asymmetry with the average values of the population may
allow
some conclusions concerning heterozygosity: in a diversity of
species,
relatively heterozygous individuals were found to have reduced
fluctuating
asymmetry and reduced
morphological
variation, suggesting a relationship beween heterozygosity and
developmental
stability. Individuals with extreme values for a morphological
character
whose variation is largely due to additive genetic variation
will tend
to
be homozygous at the loci that
influence the trait; they are also expected to be more
asymmetric than
those with central values. Relationship between extremity of
measurements
and asymmetry is highly dependant on how strongly variation of
the morphological
character in question is
controlled
by additive genetic variation and how many loci are involved. If
the number
of loci is large, then extremeness may provide a good estimate
of genomic
heterozygosity (Allendorf, Leary 1986).
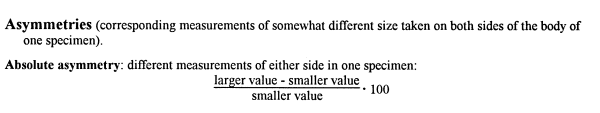
Average relative asymmetry of a series of specimens: average of all individual percentual differences between left and right measurement, including cases of bilateral symmetry.
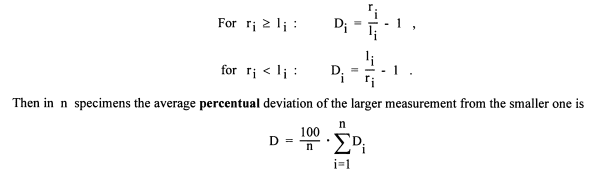
In the following formula, ri is the measurement on the right side of i-th specimen (i = 1,2,...n) and l i the measurement on the left side of the i-th specimen. The individual deviation Di of the larger measurement from the smaller one in the i-th specimen is:
Meaning of similarity / variation between populations
Degree of similarity between populations or species in relation to the variability of certain characters under investigation, in specimens of corresponding stages of development:
Examples:
Average value in population a
=
150.0; maximum value in a specimen in population a = 160.0;
Difference: 10.0: (specimen
with
maximum value lies 10.0 index units above the average value of
the population)
Average value in population a
=
150.0; average value in population b = 155.2;
Difference: 5.2 index units
between
the average values, representing the absolute deviation of
population a
from population b
The following formula is
valid for
A = average, m a
= maximum, m i
= minimum measurement of an examined sample of animals; x =
measurement
of a new specimen or average measurement of another sample to be
compared
with the former one.

Loris and
potto database
in http://www.species.net
Draft for a
measuring
standard Last
amendment: 9 August
2002